News
Updated chromosome-scale CH assembly and CH/CHO-K1 annotations
January 27, 2021
A significantly more continuous version of the Chinese hamster genome, CH PICRH (GCF_003668045.3), along with its 2020 RefSeq annotation is now on CHOgenome.org. Long-range scaffolding of the previous CH genome assembly was performed using high-throughput chromosome conformation capture (Hi-C) and now 97% of the genome is contained in 11 large scaffolds corresponding to the CH chromosomes. In addition, the updated 2020 RefSeq annotation for the CHO-K1 cell line is available. Both can be searched (gene search and BLAST) and viewed on JBrowse. More information on the most recent version of the Chinese hamster genome can be found here.
Updated CH assembly and CH/CHO-K1 annotations
May 1, 2019
We are excited to announce that the significantly improved Chinese hamster genome, CH PICR (GCF_00366804.1), along with its 2018 RefSeq annotation is now online. In addition, an updated RefSeq annotation for the CHO-K1 cell line is now available. Both can be searched (gene search and BLAST) and viewed on JBrowse. More information on the updated Chinese hamster genome can be found here.
New mRNA Expression Browser (Beta)
June 7, 2017
The browser (beta version) for the visualization of mRNA expression from CHO-K1 cells is now online. The data is from several published DNA-microarray or RNA-Seq experiments. The tutorial on how to use this browser can be found here.
Tutorial 7 – Visualizing mRNA expression in CHO cells
May 2017
Click here for PDF version.
Publically available mRNA expression data from published documents, either DNA-microarray or RNA-Seq data, can be visualized by using JBrowse. Currently, one DNA-microarray dataset GSE30321 and two RNA-Seq datasets GSE59487, GSE75094 are provided. For details on using JBrowse, please check Tutorial 5.
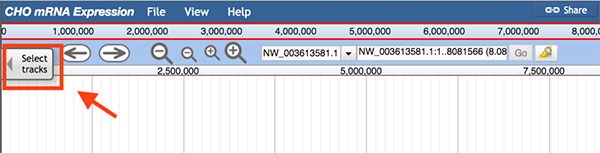
1. Track selector
When the "Select tracks" button is selected, the track menu will be displayed.
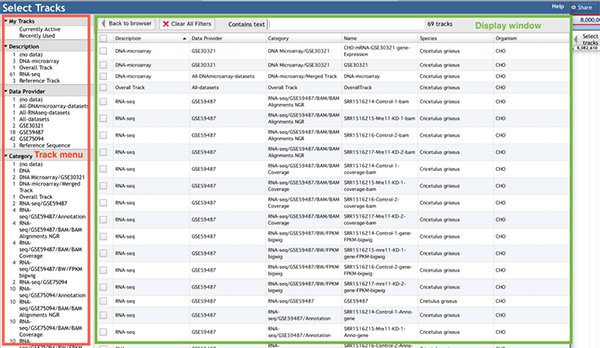
The track menu (left) lists four headings:
- 'My Tracks' contains the 'Currently active' and 'Recently used' options. 'Currently active' lists all the selected tracks in the display window. 'Recently used' lists all the recently selected tracks in the display window.
- Description' contains the four categories: 'DNA microarray', 'RNA-Seq', 'Reference Track', and 'Overall track', which are classified by data types. The 'Reference track' contains three tracks, a DNA sequence reference track, a gene reference track, and a mRNA reference track. The 'DNA microarray' and 'RNA-Seq' are the two different data types that were derived from DNA microarray and RNA-Seq studies respectively. The 'Overall track' displays the DNA microarray and RNA-Seq data in one merged track.
- 'Data provider' lists the raw dataset ID archived in the GEO database (http://www.ncbi.nlm.nih.gov/geo/). Users can search through the GEO database by using the dataset ID to obtain the raw data and a link to the NCBI or PubMed IDs, which can be used to get related documents.
- 'Category' displays various categories of tracks. It classifies tracks into different groups and sub groups based on the data type and dataset of the uploaded track. For 'DNA microarray' or 'RNA-Seq' data types, its category has the format: data type/dataset/track group/track sub group (if needed).
2. Reference track
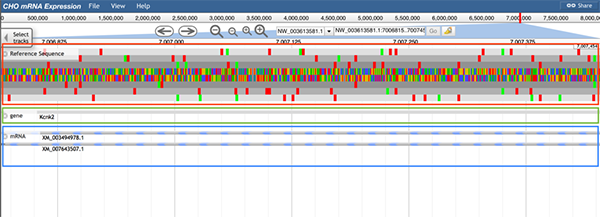
Three reference tracks are provided for users: the reference DNA sequence track, the reference gene track, and the reference mRNA track.
Follow 'Description->Reference Track' to get the reference tracks.
The reference DNA sequence track (boxed in red) displays the nucleotide sequences of the CHO-K1 genome, which are shown as colored blocks. The reference gene track (boxed in green) displays the gene symbol/ID and location. The reference mRNA track (boxed in blue) indicates possible exons, introns, and coding sequences (CDs) for each gene (can click the track for details).
3. Overall track
The 'Overall track' is the combination of data both from DNA-microarray and RNA-Seq experiments. The function of the 'Overall track' is to guide users to the certain type of data that contains their gene expression information of interest.
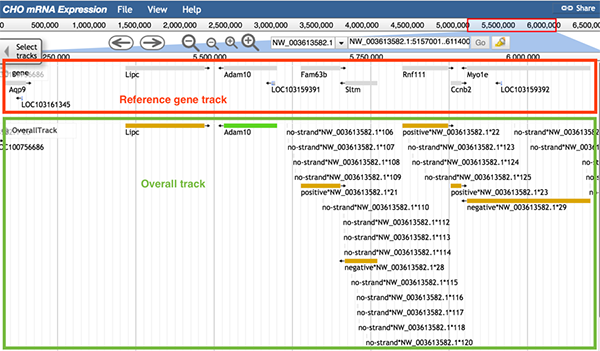
Follow 'Description->Overall Track' to the overall track.
The reference gene track (boxed in red) and Overall track (boxed in green) are displayed. The regions shown in the Overall track as blocks are regions that have been expressed in a certain experiment (either DNA microarray or RNA-Seq) or several experiments (DNA microarray and RNA-Seq). When zoomed in, users can see that the overall track has two colors. The two different colors are used to distinguish the sources of data. If the sequence can be found expressed in every source, the sequence is shown as a green block. If at least one source did not express that sequence, the sequence is shown as a yellow block.
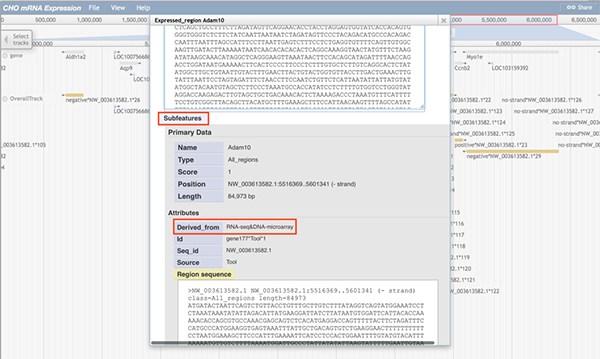
When any part of a block (a block may consists of several continuous sequences/parts) is clicked, a pop-up window will show the track feature information. The image below shows information about the gene Adam10. When gene Adam10 is clicked, the pop-up window will dispaly basic sequence information such as the gene's name and position. The 'Subfeatures' section indicates which data type contains this region. For details on feature tracks, please check Tutorial 5.
4. Data type track
The Overall track provides information on the type of data that contains the user's genes of interest.The data type track can easily guide users to find the datasets from the specific data type that contain their genes of interest. A data type track is provided for either DNA microarray data or RNA-Seq data.
To get the DNA-microarray data type track, follow 'Description->DNA-microarray', 'Data Provider->All-DNA-microarray-datasets', and 'Category->DNA-microarray/Merged Track' to the data type track.
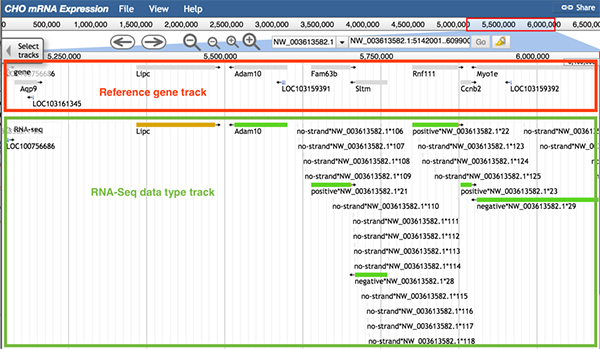
To get the RNA-Seq data type track, follow 'Description->RNA-seq', 'Data Provider->All-RNAseq-datasets', and 'Category->RNA-seq/Merged Track' to the data type track.
The usage of the data type track is similar to the overall track. The image below shows information of the RNA-Seq data type track. When zoomed in, there are two colors in the data type track used to distinguish the sources of data. If the sequence can be found expressed in every dataset, the sequence is shown as a green block. If at least one dataset did not express that sequence, the sequence is shown as a yellow block.
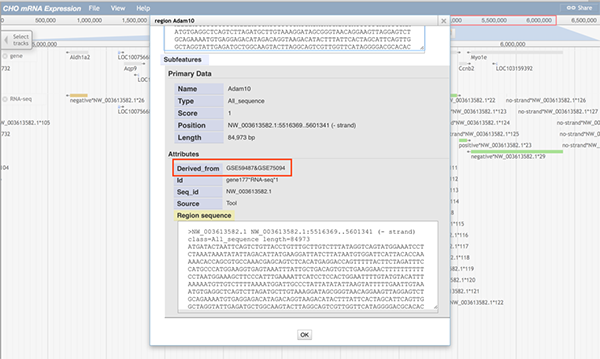
When any part of a block (a block may consists of several continuous sequences/parts) is clicked, a pop-up window will show the track feature information. The image below shows information about the gene Adam10. When gene Adam10 is clicked, the pop-up window will display basic sequence information such as the gene's name and position. The 'Subfeatures' section indicates which dataset contains this region.
5. DNA-microarray data
Two types of tracks are provided for each DNA-microarray dataset, the DNA-microarray dataset track and the DNA-microarray gene expression level track.
5.1 DNA-microarray dataset track
Samples (replicates) in the same DNA-microarray experiment contain gene expression values for the same genes. The function of DNA-microarray dataset track is to display only expressed genes.
Follow 'Description->DNA-microarray', 'Data Provider->DNA-microarray dataset ID', 'Category->DNA microarray/DNA-microarray dataset ID-> DNA-microarray dataset ID' to the DNA-microarray dataset track.
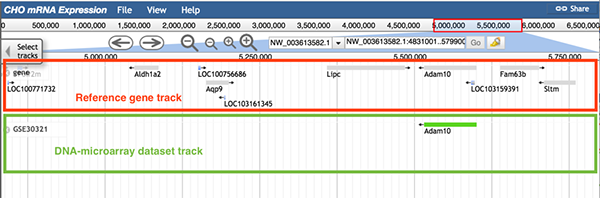
The image below shows information of DNA-microarray dataset GSE30321. Each green block in the track represents an expressed gene, and the gene symbol is displayed.
5.2 DNA-microarray gene expression level track
The DNA-microarray gene expression level track visualizes the gene expression levels.
Follow 'Description->DNA-microarray', 'Data Provider->DNA-microarray dataset ID', 'Category->DNA microarray/DNA-microarray dataset ID->gene expression' to the DNA-microarray gene expression level track.
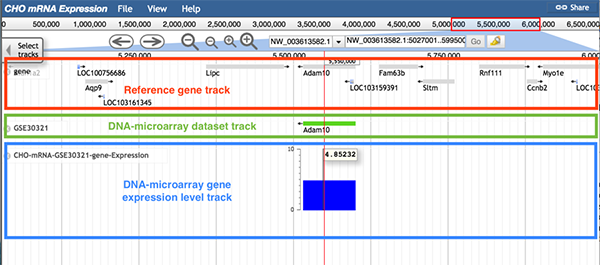
The image below shows one gene expression level track (boxed in blue) from dataset GSE30321. Each blue block represents an expressed gene. The position of a block represents the gene's position. The height of a block represents the gene's expression level. A scale bar is provided near the track for reference. A red line will be used to highlight the top layer of the block when a gene expression value is higher than the maximum value on the scale. In addition, hovering the cursor over the blocks in the track will display the gene expression value measured within this sample's condition.
6. RNA-Seq data
Six types of tracks are provided for each RNA-Seq dataset, including two types of tracks for the dataset and four types of tracks for each sample (replicate).
6.1 RNA-Seq dataset track
Samples in the same RNA-Seq experiment may contain different gene expression values for different genes. The function of the RNA-Seq dataset track is to help users identify which samples expressed their genes of interest.
Follow 'Description->RNA-seq', 'Data Provider->RNAseq-dataset ID', and 'Category->RNA-seq/RNA-Seq dataset ID->RNA-Seq dataset ID' to the RNA-Seq dataset track.
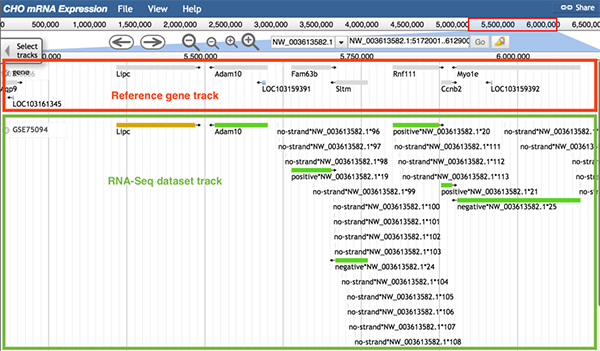
The usage of the RNA-Seq dataset track is similar to the data type track. The image below shows information of the RNA-Seq dataset track from dataset GSE75094. When zoomed in, there are two colors in the dataset track used to distinguish the sources of data. If the sequence can be found expressed in every sample, the sequence is shown as a green block. If at least one sample did not express that sequence, the sequence is shown as a yellow block.
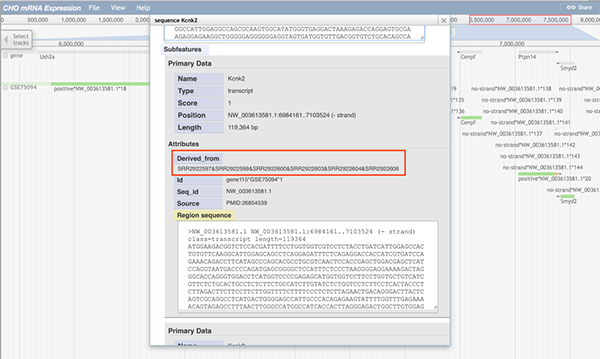
When any part of a block (a block may consists of several continuous sequences/parts) is clicked, a pop-up window will show the track feature information. The image below shows information about the gene Adam10. When gene Adam10 is clicked, the pop-up window will diaplay basic sequence information such as the gene's name and position. The 'Subfeatures' section indicates which sample contains this region.
6.2 RNA-Seq reads mapping tracks
The RNA-Seq reads mapping tracks are two BAM tracks used to visualize RNA-Seq reads mapping information for each sample.
Follow 'Description->RNA-seq', 'Data Provider->RNAseq-dataset ID', and 'Category->RNA-seq/RNA-Seq dataset ID/BAM/BAM alignments NGR or BAM Coverage' to the RNA-Seq reads mapping track.
The 'BAM coverage feature track' is composed of histograms to represent the coverage of RNA-Seq reads in the given position. It also has a scale bar, and uses a red top to indicate values that are bey
ond the scale.The 'BAM alignment feature track' shows read alignment for the condition/sample. Each dot represents a read and its position indicates where the read was mapped to the scaffold. There are two colors of the dots to di
stinguish the direction of the read. Red indicates a read mapping to the positive strand, and the blue indicates the read mapped to the negative strand. Additionally, a black bar within a read indicates that the read has been separated into several pieces in order to map to the scaffold.The image below shows information of the RNA-Seq reads mapping track. The reference gene track (boxed in red), the coverage BAM track (boxed in green) and alignment BAM track (boxed in blue) are displayed. The alignment BAM track di
splays many reads and how these reads were mapped to the genome. By hovering the cursor over the coverage BAM track, users can identify the density of reads in the given position.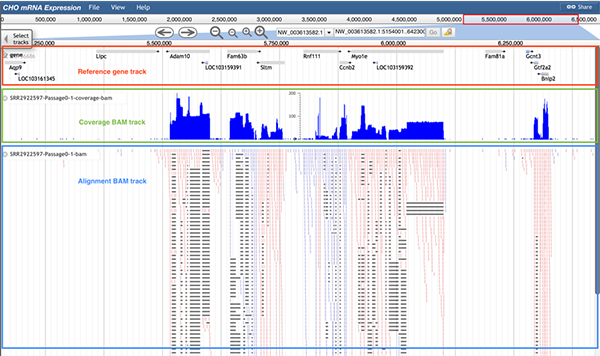
6.3 RNA-Seq sample annotation track
The RNA-Seq sample annotation track contains annotated mRNA information for each expressed gene.
Follow 'Description->RNA-seq', 'Data Provider->RNAseq-dataset ID', and 'Category->RNA-seq/RNA-Seq dataset ID/Annotation' to the RNA-Seq sample annotation track.
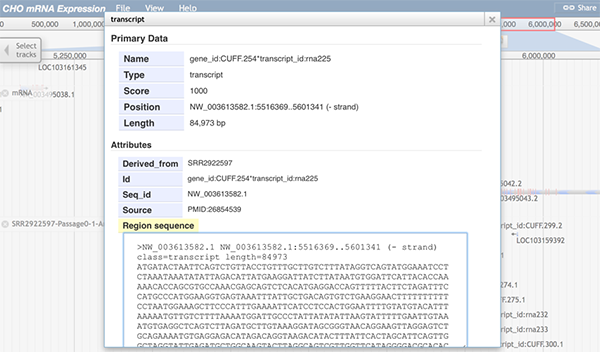
The image below shows information of the RNA-Seq sample annotation track. The reference gene track (boxed in red), reference mRNA track (boxed in green), and annotation GFF3 track (boxed in blue) are displayed. For gene Adam10, both the reference mRNA track and the annotation GFF3 track have one mRNA, but the gene ID of mRNA in the annotation GFF3 track (gene id: CUFF.254) is different than the gene ID in the reference gene track. For gene Ccnb2, the gene ID of mRNA in the annotation GFF3 track (Ccnb2) is same as the gene ID in the reference gene track. Same gene ID means that the sequence of this gene in the annotation GFF3 track is entirely the same as the sequence of this gene in the reference gene track. Therefore, the gene Ccnb2 sequence is more consistent with that of the reference tracks during the experiment. Compared to the gene Adam10 (gene IDs are different in reference gene track and annotation GFF3 track), users will have higher confidence in saying Ccnb2 was expressed in the sample.

When any part of a block is clicked, a pop-up window will display detailed information of the selected mRNA.
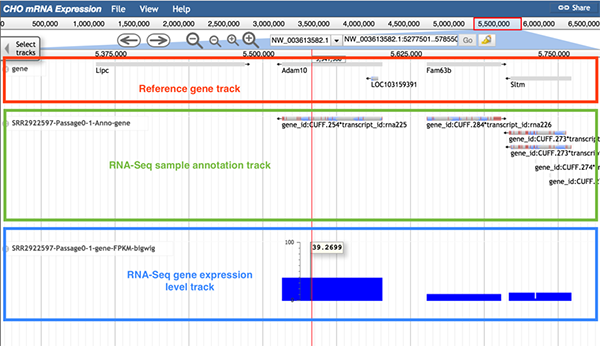
6.4 RNA-Seq gene expression level track
The RNA-Seq gene expression level track visualizes the gene expression levels.
Follow 'Description->RNA-seq', 'Data Provider->RNAseq-dataset ID', and 'Category->RNA-seq/RNA-Seq dataset ID/BW/FPKM bigwig' to the RNA-Seq gene expression level track.
The image below shows information of the RNA-Seq gene expression level track. It is highly recommended to use the gene expression level track with the reference gene track and the sample annotation track. The reference gene track helps users quickly find their gene of interest. The sample annotation track displays all expressed genes. In the gene expression level track, the height of each column and its value represent the gene expression FPKM value.
6.5 RNA-Seq differential gene expression track
The RNA-Seq differential gene expression track contains the comparison result of gene expression level among different samples or conditions.
Follow 'Description->RNA-seq', 'Data Provider->RNAseq-dataset ID', and 'Category->RNA-seq/RNA-Seq dataset ID->differential gene expression ' to the differential gene expression track.
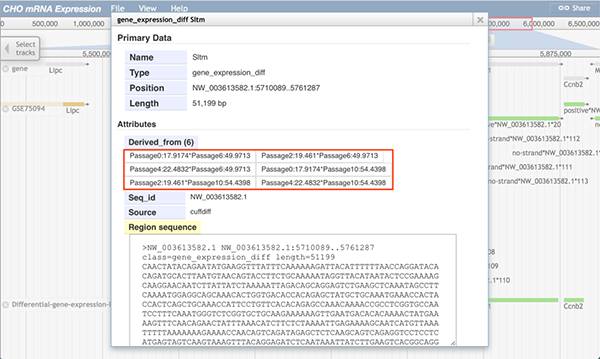
The image below shows information of the RNA-Seq differential gene expression track. The reference gene track (boxed in red), dataset track (boxed in green), and the differential gene expression track (boxed in blue) are displayed. In the differential gene expression track, a green block means that the gene in the selected position is differently expressed between two conditions. For instance, gene Adam10 was expressed (shown block in dataset GFF3 track), but it was not differentially expressed between any paired conditions (shown as no block in the differential GTF track). On the contrary, the gene Sltm has one green block, which means the gene Sltm was expressed differentially between paired conditions.
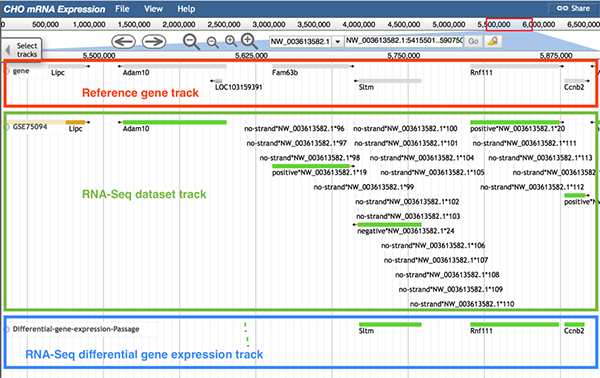
When users click on a block, a pop-up window will display more information about which two groups expressed the gene differently.
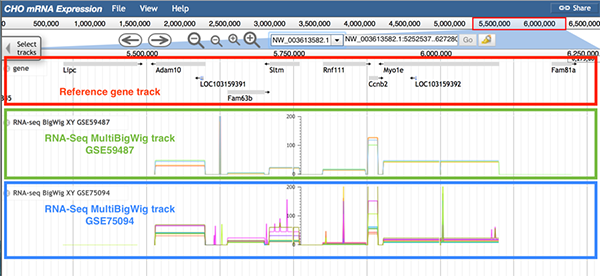
6.6 RNA-Seq MultiBigWig track
The RNA-Seq MultiBigWig track contains gene expression level tracks from different conditions within a dataset.
Follow 'Description->RNA-seq', 'Data Provider->RNAseq-dataset ID', and 'Category->RNA-seq->RNA-seq BigWig ' to the RNA-Seq MultiBigWig track.
The image below shows information of the RNA-Seq MultiBigWig track. The reference gene track (boxed in red), the RNA-Seq MultiBigWig track for GSE59487 (boxed in green), and the RNA-Seq MultiBigWig track for GSE75094 (boxed in blue) are displayed. In the RNA-Seq MultiBigWig track, bigWig tracks from all samples within the same dataset are displayedin one track. A unique color was selected for the bigWig track of each sample. For instance, if the gene Adam10 is the gene of interest, a difference among the tracks exists in the MultiBigWig track GSE59487. For more detailed gene expression information, users can check the gene expression level track and the differential gene expression track.